Department Events
Expert lecture on “Importance of Professional Association for Career Development” on 25/09/2023
Department of Electrical
Engineering in Association with IET On-Campus Organizes Expert Lecture on “Importance of Professional Association for Career
Development” for TE (A and B) students and staff of the department
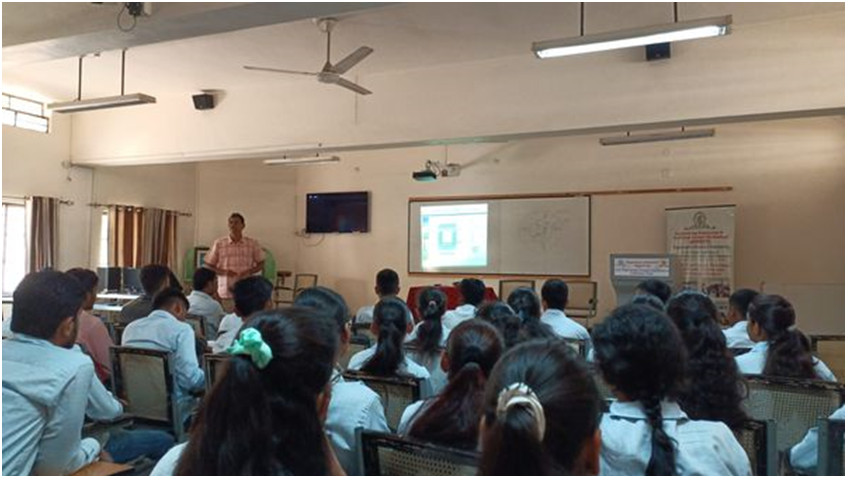
on 25/9/2023: Resource Person: Mr. Amitabh
Sinha, Co-founder & Chief Strategy Officer, Founder at Dcy phr. Total no. of Students present = 142. In this session, the students participating in the regional
round of the IET India Scholarship Award were felicitated with the hands of Mr.
Amitabh Sinha. The Participating students also shared their views and
experiences of participating in this Award Competition.


Expert lecture on “Artificial Intelligence-Opportunities for Future Engineers” on 27/09/2023
Department of Electrical
Engineering in Association with IET On-Campus Organizes Expert Lecture on “Artificial
Intelligence- Opportunities for Future Engineers” for BE (A and B) students and staff of the department
on 27/9/2023: Resource Person: Mr. Amitabh
Sinha, Co-founder & Chief Strategy Officer, Founder at Dcyphr. Total No. of Students present = 68. The
lecture helped students to understand the importance of artificial
intelligence, what the basics of AI are and how to grab the opportunity in AI
for the job. The expert also discussed the artificial intelligence theory and
trends in the industry of artificial intelligence.

Expert Lecture on “Guidance for Competitive Exam” on 15/09/2023
Electrical
Department in Association with EFFECT Student Body has organized an Expert
Lecture on “Guidance for Competitive Exam” for TE Electrical Division: A and B students and staff of the
department on 15/9/2023: Resource Person: Mr. Saurabh Sonawane, Educator-In
chief at Unacademy. Total No. of Students present = 90. This lecture helped students to understand the pattern of
competitive exams, how to crack the exam and the importance of competitive exams
and job opportunities in the government sector.

Department Advisory Board Meeting on 18/09/2023
The department conducted the “Department Advisory Board Meeting” on
18th September 2023 in the presence of Hon. Members and all the faculty
members.

Expert Lecture on “Power Transformer” on 23/09/2023
The department conducted an expert session of Mr. Pankaj Patil (Additional Executive
Engineer MSETCL) on 'Power Transformer'
on 23/09/2023 as a part of the course delivery by the industry expert under
Autonomy. Total No. of Students present = 58.

Certificate Course on ‘Control Panel Design’ on 14/09/2023
The department has conducted the Certificate Course on
‘Control Panel Design’ for TE and BE
students. Total No. of Students participated
= 45.

Certificate Course on ‘PLC and SCADA’ on 14/09/2023
The Department has conducted the Certificate Course on
‘PLC and SCADA’ for BE (Div B) students.


Student Corner
Student Placement
The following
students are placed in various multinational companies. Congratulations to all
the students!
Placed Students Details (September - 2023)
|
Sr. No. |
Name of the Student |
Placement Date |
|
1. |
Shewale Sanjana Bhagwan
|
09/12/2023 |
|
2. |
Sakshi Raosaheb Patil |
09/12/2023 |


Congratulations!
ABB Digi Connect 2023 Competition
ABB
Company organized the ABB Digi Connect
2023 Competition for engineering colleges. Various colleges participated
in this event. K. K. Wagh team won first prize in the ABB Digi Connect 2023
Competition. The student team members of Sakshi Girase (Electrical), Tejaswini
Rajput (R&A), Prathamesh Gadilohar (IT), Anush Devadiga (E&T), and
Yash Mahale (CSE) participated from the college. Team College Coordinator, Prof.
Saravanan S. Congratulations to all of them!


Congratulations!
On Teachers Day, Dr.
S. S. Dhamal (30 years), Dr. R. K.
Munje (10 years), Prof. J. D. Patil
(20 years) and Mrs. Shubhada Borade
(30 years) are felicitated with the hands of Dr. Vinayak Govilkar for completing the long service in the K. K.
Wagh Institute of Engineering Education and Research. Congratulations!


Industry collaboration
Industry visits by the department faculty members to Hyosung India Pvt. Ltd., Pune to
interact with Alumni and Industry professionals for collaboration on 13th
September 2023. The visit was attended by Prof. Saravanan S along
with Dr. P. J. Pawar (HOD, Robotics and Automation), Dr. P. K.
Shahabadkar (T&P Officer) and Prof. Gokul Jadhav.


Congratulations!
On Engineers Day, Prof.
Dr. Munje and Prof. Saravanan
are felicitated for writing and publishing research papers in peer-reviewed
journals and Prof. Dr. Abhishek is felicitated for completing the PhD
from NIT. Felicitation was done with the hands of Hon. Shri. Narendra Goliya in the presence of Principal Dr. Keshav Nandurkar.


Student Articles
Temperature
rise test and analysis of high current switchgear in the distribution system

Sayeed Hussain Naik
TE-A-Electrical Engineering
syeednaik@gmail.com
Abstract
As the load of the power system continues to increase, the capacity of the switchgear climbs, resulting in the overheating problems becoming more serious. To realize the monitoring of the temperature of the switchgear, the authors need to conduct a thorough analysis of the temperature rise principle of the switchgear first. To get the detailed temperature distribution in the switchgear, a series of temperature rise tests were carried out based on the KYN28A-12(Z) overhead line switchgear and the data were analyzed and compared in detail to summaries the factors that affect the temperature distribution in the switchgear.
1. Introduction
In recent years, the increasing power load has brought new challenges to the stable operation of switchgear. The resistance of switchgear grows with the operation, resulting in overheating in switchgear, which leads to power failure or even an explosion accident [1, 2]. References [1–4] analyzed the reasons for overheating as well as abnormal heating of the switchgear. Reference [5] dealt with the problems existing in the KYN28A-12 kV/4000 A switchgear and improved its structure. The improved performance was analyzed through simulation. Reference [6] has carried out a detailed simulation of the thermal field and the airflow field in the switchgear. Reference [7] introduced an advanced temperature measurement technology and a practical switchgear temperature warning system. However, there is little research on the rate of temperature rise and regular pattern of temperature distribution of switchgear.
2. Temperature rise tests of the switchgear
In order to get the detailed temperature distribution in the switchgear, we chose a KYN28A-12(Z) overhead line switchgear and conducted a series of temperature rise tests. 2.1 Equipment used in the temperature rise test In the tests, the KYN28A-12(Z) overhead line switchgear is shown in Fig. 1, in which A is the bus room, B is the instrument room, C is the circuit breaker room, and D is the overhead line room. The main heating points in the switchgear are located on the contact surfaces of the buses and branches in the bus room and the surfaces between the fixed contacts and the moving contacts in the circuit breaker room. The switchgear seals well because of meeting the requirement of arcing. There are three fans installed at the top of the bus room, as well as two fans installed at the top of the circuit breaker room. The power of each fan is 65 W. Two blowers are installed below the circuit breaker room, one of which is 270 W and the other is 70 W.

2.2 Positions of Temperature Sensors
Considering that the contact resistance of the contact surfaces is far greater than the resistance of the metal itself, we will place more platinum resistance temperature sensors at the main heating points as mentioned above. In the bus room, the sensors are placed in the following positions: the outlet of the fixed contact box, branches, and contact surfaces of the buses and branches. In the circuit breaker room, the sensors are placed in the following positions: outside top, bellow, left and right of all plum contact, inside top, bellow, left and right of phase B upper plum contact, outside top and left of the breaker arm, inside of the breaker arm, fixed contacts, the contact surfaces of the fixed contacts and branches.
2.3 Contents of temperature rise tests.
To
obtain more data, we set up different test conditions to simulate various
situations that may occur in the actual operation of the switchgear.
Temperature data is collected by the temperature monitoring software per
minute. The following are the contents of temperature rise tests.
(I)
Set the input current of three phases to 4400 A with the ventilation equipment
off during the test. The resistance of phase A is 23 μΩ, phase B is 23 μΩ, and
phase C is 22 μΩ.
3. Comparison and analysis of data
After a series of temperature rise tests, we have obtained a lot of data. In the following sections, we conduct a detailed analysis of the data and reach conclusions.
3.1 Comparison of temperature rise at the same positions of different phases
We chose the data from test 1 and test 5 to compare. The temperature rise of the outside top of the plum contact represents the temperature rise of the whole plum contact. (The following data are the same.) Fig. 2 shows the comparison of the temperature rises of the three-phase lower plum contacts in test 1. Fig. 3 shows the comparison of the temperature rises of the three-phase lower plum contacts in test 5.
Based on Figs. 2 and 3, it can be concluded that the temperature rise values at the same positions of different phases are basically the same when the ventilation equipment is off. However, the values change after turning on the ventilation equipment, because the speed of air changes sharply, which influences the temperature rise values.

Fig. 2 Comparison of the temperaturerises of the three-phase lower plum contacts in test 1

Fig. 3 Comparison of the temperature rises of the three-phase lower plum contacts in test 5
3.2 Comparison of temperature rise at different positions of the same phase
We
chose the data from test 5 to compare. The temperature rise of the outside top
of the breaker arm represents the temperature rise of the outside of the
breaker arm. (The following data are the same.) As shown in Fig. 4.
According to Fig. 4, we find that the temperature rise inside the breaker arm is the highest, followed by the outside of the breaker arm, the plum contact, the fixed contact, the contact surface of the fixed contact and branch, the outlet of the fixed contact box, the branch and the contact surface of bus and branch. The temperature rise has a great relationship with the speed of the surrounding airflow, and there is no significant difference in the temperature rise between two points not far from each other on the copper bus. This is the gradient of temperature distribution when the switchgear operates normally.

Fig. 4 Comparison of the temperature rises of phase C upper plum contact and the nearby positions in test 5
3.3 Comparison of temperature rise at different positions of the same plum contact
We
chose the data from test 1 and test 5 to compare. Fig. 5 shows the comparison
of temperature rise at different positions of the same plum contact in test 1.
Fig. 6 shows the comparison of temperature rise at different positions of the
same plum contact in test 5. According to Figs. 5 and 6, we see that when the
ventilation equipment is off, the temperature rise in the four directions
inside of the plum contact of phase B is basically the same, while the
temperature rise in the four directions on the outside is slightly different.
When the ventilation equipment is turned on, although the temperature rise
values vary obviously, it can still be ruled that the temperature rise inside
is higher than the same position on the outside.

Fig. 5 Comparison of temperature rise at
different positions of the same plum contact in test 1

Fig. 6 Comparison of temperature rise at
different positions of the same plum contact in test 5.
Moreover,
the Figs. 5 and 6 also prove that there is a difference in the temperature rise
value of each position of the plum contact when the ventilation equipment is
off. This is due to the complex equipment in the circuit breaker, causing the
speeds of air flow at different positions to be different.
3.4 Comparison of temperature rise in different input currents
We
choose the data of test 1, test 2, test 3 and test 4 to compare. The comparison
of temperature rise of phase C upper plum contact in different input currents
is shown in Fig. 7. According to Fig. 7, we find that the rates and stability
values of temperature rise differ significantly in different input currents. By
comparing the regular pattern of temperature rise in different input currents,
we can obtain the differences in the temperature distribution gradient.

Fig. 7 Comparison of temperature rise of
phase C upper plum contact in different input currents.
According to Fig. 7, we find that the rates and stability values of temperature rise differ significantly in different input currents. By comparing the regular pattern of temperature rise in different input currents, we can obtain the differences in the temperature distribution gradient.
3.5 Effect of ventilation equipment on temperature rise
We
choose the data of test 1, test 2, test 5 and test 6 to compare the temperature
rise of phase C upper plum contact, which is shown in Fig. 8. From Fig. 8, we
can see that the ventilation equipment has an effect on the regular pattern and
rate of temperature increases, and the temperature rise value is stabilized
quicker after the ventilation equipment is turned on.

Fig. 8 Comparison of temperature rise of phase C upper plum contact with the ventilation equipment on or off.
3.6 Effect of unbalanced current on temperature rise
We
choose the data of test 5, test 7 and test 8 to compare the temperature rise of
phase C lower plum contact, which is shown in Fig. 9. According to Fig. 9, it
can be seen that when the input current of one phase is missing, the heating of
switchgear is reduced, and the rate of temperature rise and regular pattern of
temperature distribution have certain changes.

Fig. 9
Comparison of temperature rise of phase C upper plum contact in
unbalanced current.
According
to Fig. 9, it can be seen that when the input current of one phase is missing,
the heating of switchgear is reduced, and the rate of temperature rise and
regular pattern of temperature distribution have certain changes.
4 Conclusions
This
article carries a series of temperature rise tests based on KYN28A-12(Z)
overhead line switchgear, compares and analyzes the data obtained, and reaches
the following conclusions.
(i)
The ventilation equipment has an obvious impact on the rate of temperature rise
and regular pattern of temperature distribution of switchgear.
(ii)
The different input current has an obvious impact on the rate of temperature
rise and regular pattern of temperature distribution of switchgear.
(iii)
The unbalanced current has a certain impact on the rate of temperature rise and
regular pattern of temperature distribution of switchgear.


No comments:
Post a Comment